Finding Extrema of a Function
We want to find the extrema of the function
> f := sin(x)*exp(-2*x^2);
![]()
> df := diff(f, x);
![]()
> solve(%, x);
![]()
Since maple can't solve this equation analytically, we ask for a numeric solution:
> fsolve(df, x);
![]()
We don't trust this simple solution blindly, but try to get a qualitative overview by plotting the function:
> plot(f, x=-10..10);
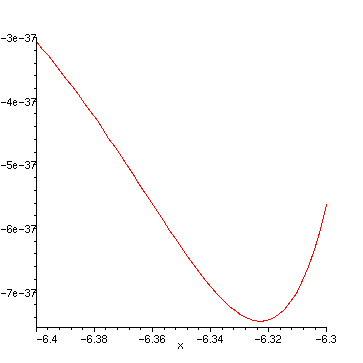
This doesn't seem to agree with the numeric result, so we take a closer look:
> plot(df, x=-6.5..-6);
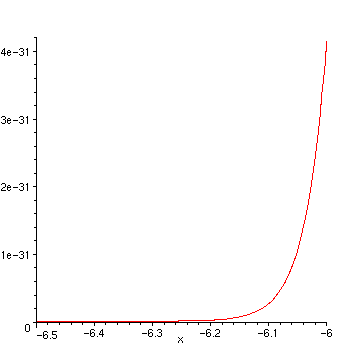
The high precision of maple calculations allows us to refine even more:
> plot(f, x=-6.4..-6.3);
This at last confirms the former result. But we are more interested in the "main" peak between 0 and 1:
> fsolve(df, x, 0..1);
![]()
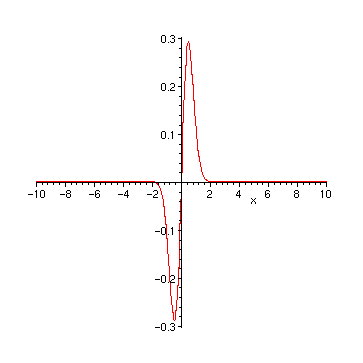
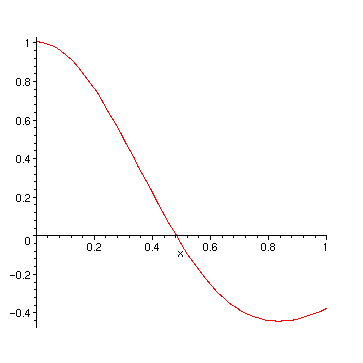
And again we use a plot for a gross check of the numerics:
> plot(df, x=0..1);
To get an overview of all solutions, we go back to the algebraic solution:
> minmax := solve(df, x);
![]()
> sol := op(1,%);
![]()
A direct plot of this equation doesn't help much:
> plot(sol, _Z=-10..10);
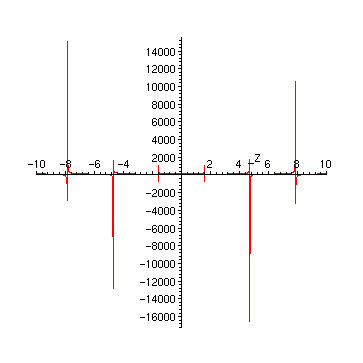
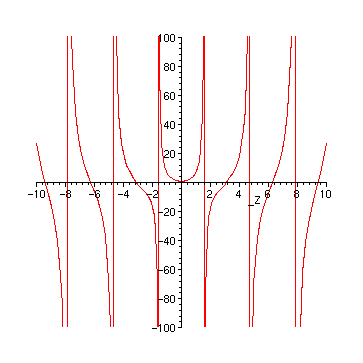
The reason for the strange plot are of course the poles of the tan. A first improvement is to restrict the range values:
> plot(sol, _Z=-10..10, -100..100);
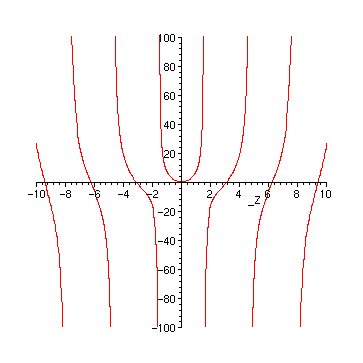
Finally, the nasty lines at the poles disappear, if we plot only the continuous parts:
> plot(sol, _Z=-10..10, -100..100, discont=true, color=red);
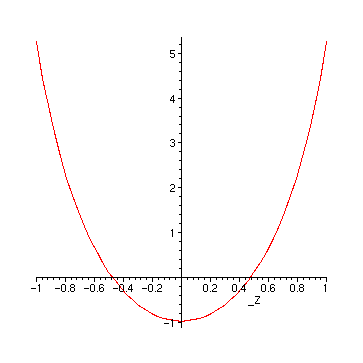
Only the region around 0 needs a closer look:
> plot(sol, _Z=-1..1);