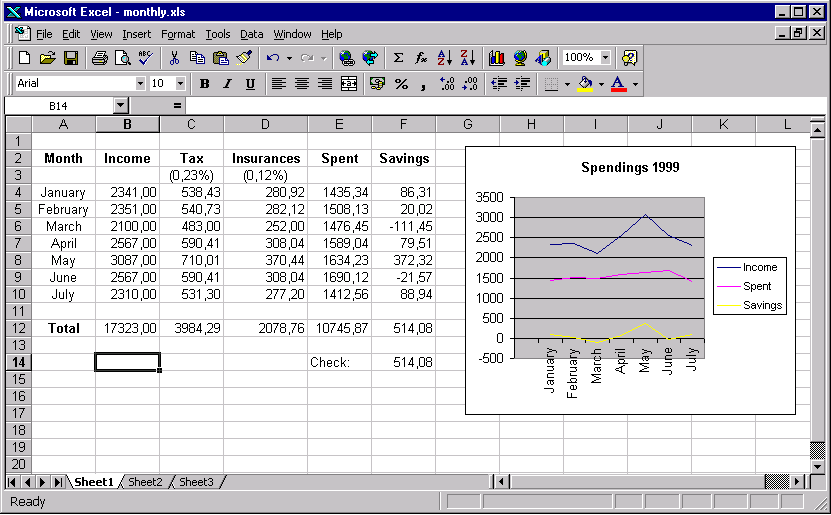
Spreadsheet

$\bullet$
An important standard application is the spreadsheet. It is used mainly for analysis and visualization of data, if the amount of data is not too large and the calculations are not too complicated.

$\diamond$
This screen dump shows a typical spreadsheet in Excel97:

3031

Element Function
menue and symbol bars like in Word97
status line like in Word97
spreadsheet area instead of text area
cell input bar allows to enter data for a cell

$\bullet$
Each cell of a spreadsheet is denoted by its coordinates: a letter for the column index, a number for the row. Rectangular regions of cells can be given by specifying the upper left and the lower right corner, separated by a colon.

$\diamond$
cells content
E14 String ``Check:''
B2:B12 Income values
A7:F7 values for april
A2:F14 complete data area

$\bullet$
Usually one cell is active, shown by a thick border around it. It's coordinates are displayed in the cell input bar, together with its content, which can be edited here.

$\bullet$
A cell can contain numerical data, strings (e.g. for explanations) or formulae to compute the value of the cell from the values of other cells.

$\diamond$
cells content
A5 string
B7 numerical data
C8 a formula

$\triangleright$
If one changes a cell value, all cells that are computed directly or indirectly from this one are recalculated. This is the essence of the spreadsheet concept.

$\bullet$
The content of a cell can be formatted, using the usual functions for fonts, style or alignment. Numerical values can be displayed in a lot of formats, e.g. with a fixed number of digits after the decimal point.

$\bullet$
Formulae can be entered directly into the cell input area by starting with a '='. They can contain the usual arithmetic operations, one or more of a lot of predefined functions and the coordinates of a cell or a cell region, they use.

$\diamond$
cell content meaning
C4 =B4*0.23 value of cell B4 multiplied by 0.23
F9 =B9-C9-D9-E9 Income - Tax - Insurances - Spent
C12 =SUM(C4:C11) sum of the column C4:C11

$\triangleright$
Often cells in a column contain the same formula, but with changing operand, according to its row (e.g. C4=B4*0.23, C5=B5*0.23 etc.). Such a pattern can be created by entering the first formula and dragging the border of the its cell, until all corresponding cells are covered. Excel copies the data into the new cells and tries to infer, which column or row indices should be adapted.

$\bullet$
Spreadsheet programs contain a large set of diagram types to visualize the data. A so called Wizard helps with the creation of a diagram: It displays a series of windows, where all relevant information (data to display, type of diagram, legend style ...) can be entered.

$\triangleright$
Current spreadsheets can cope with quite a lot of data and provide rather complicated functions. Nevertheless one should not overuse the spreadsheet paradigm! The proper tool for large data sets is a data base. For complicated computations one should use a statistical package, a general numeric problem solver like Matlab or even write a special program.

previous    contents     next

Peter Junglas 8.3.2000